10 Important Continuous Delivery Metrics for Optimizing Performance
Top 10 Continuous Delivery MetricsMonitoring progress and performance is essential in a software development process. CI/CD metrics enable teams to produce software updates more quickly and with greater quality. Also, these metrics offer important insights into the efficiency of the deployment process.
So, to ensure that our efforts are not worthless, this article will cover the most important CD metrics to promote ongoing and optimized development. Let’s examine the CI/CD procedures and key performance indicators and understand the benefits of the development plan.
The Importance of Tracking CD Metrics
Organizations are using Continuous Integration and Continuous Deployment (CI/CD) methods more and more to speed up software delivery and enhance overall product quality. Monitoring CI/CD metrics is crucial because developers can locate bugs, streamline procedures, and make faster decisions for ongoing development.
Also, these metrics provide valuable data about the CI/CD pipeline's effectiveness, stability, and reliability. You can maintain pipeline health and remain ahead of the competition by monitoring and responding to your CI/CD data.
10 Key Continuous Delivery Metrics to Track
Tracking the CI/CD metrics ensures the efficiency of the CI/CD performance. These metrics also provide full insights into the status of your simple CI/CD pipeline, as well as find places to improve. Some of the best continuous delivery metrics to track are:
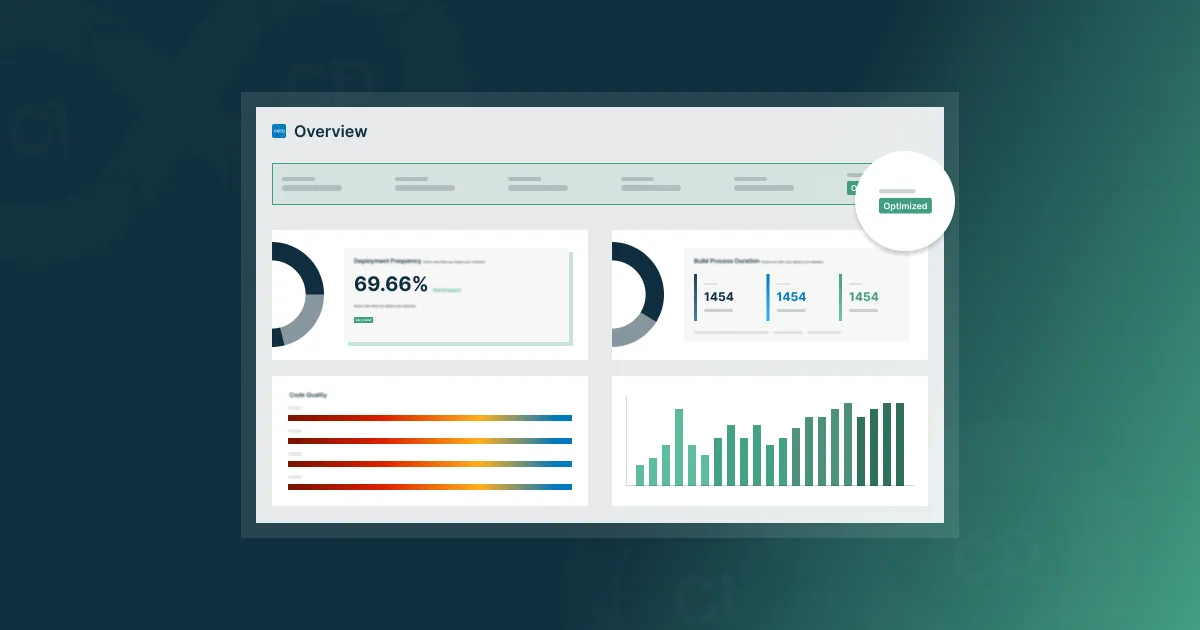
1. Deployment Frequency
Deployment frequency shows how often you deploy your software. This metric is important because it provides how the customers are satisfied with the use. According to their needs and feedback, you bring value.
2. Code Quality
Track the code quality to enhance the CI performance. In certain situations, evaluating code quality can also enhance the software you produce. The number of broken builds can be reduced by tracking the code quality while developers can test and debug the code.
3. Lead Time
The lead time is the duration between the time a code change is committed and when it is put into production. It measures how quickly you can go from developing to delivering software improvements. This metric helps to run the code successfully without compromising the quality.
4. Build Process Duration
The time needed to finish a software build process is measured by a metric called build duration. Tracking this metric can increase efficiency, where developers can iterate faster. Also, it impacts the cost of cloud-based development environments.

5. Failure Rate
Failure rate measures how often the software bugs, fails, or has negative user feedback. It analyzes how carefully you test and validate your software changes before deployment. This metric can help to minimize failures without affecting delivery speed.
6. Mean Time to Recovery
Mean time to recovery or MTTR, is the average time your system takes to recover from a failure. The main goal is to reduce the MTTR as much as you can without sacrificing quality. This can help to minimize additional issues.
7. Mean Time to Detect
Mean time to detect is another important metric because it tracks the average time your system detects a bug or failure. Tracking this metric helps to easier identify areas that need to be improved.
8. Test Coverage
Test coverage is a technique that measures how many functions are covered when you run a test. Both code coverage and test coverage can enhance the quality of your code as well as your continuous integration process.
9. User Feedback
The user feedback is the review you will receive from a customer. Metrics such as user satisfaction, engagement, revenue, and conversion are all included as a part of the user experience and feedback. User feedback reflects how well you satisfy the expectations of the users as well as the value you provide them.
10. Rollback Rate
The rollback rate measures the number of deployments that are redone after a failure. By assessing the stability of your code releases, this statistic allows you to focus more on the adjustments that are required.
How To Use CI/CD Metrics for Optimized Performance
Continuous Delivery Metrics are very crucial for teams to produce software more quickly and reliably. Using automated software testing can boost productivity and lower costs. So, if you want to optimize the CI/CD pipeline, you should:
- Monitor Build Time: Monitoring build time determines how long a build takes to finish. Minimizing build time improves development cycles, and increases frequency. This can lead to positive feedback while reducing downtime and failures.
- Analyze Trends: Always analyze any new improvements that should be implemented. There are areas where changes are needed for better optimization.
- Automate Testing: For faster and better results, try to use automated tools. They help to early detect bugs and failures, so developers can solve them before they impact the end user. Tools like Microtica can help to achieve this.
- Choose Best Metrics: Carefully choose the metrics according to your business goals. These metrics can help achieve better results while optimizing performance.
- Optimize Continuously: Making improvements is a continuous process. Develop the habit of reviewing your measurements, streamlining your procedures, and striving for improved outcomes.
Tracking CI/CD metrics is crucial for enhancing your software development and delivery processes. Remember these key points for your upcoming procedures.
Conclusion
You may learn how to enhance your software delivery process by following continuous delivery metrics. You can evaluate success rates, improve feedback loops, and lower production failures while still preserving reliability. Tracking CD metrics helps to determine how well your deployment procedures are working and where they need to be improved.

Relevant Posts