Mastering Cloud Monitoring & Alerting with Microtica
Effective cloud monitoring and alerting are crucial for maintaining the health of your cloud infrastructure. As businesses increasingly rely on cloud services for operational efficiency and scalability, the importance of having a robust monitoring system in place cannot be overstated.
Without the right monitoring tools, organizations risk experiencing downtime, performance degradation, and ultimately, a negative impact on user satisfaction and business outcomes.
This guide explores how to leverage Microtica’s advanced cloud monitoring functionalities to ensure your applications remain reliable and performant, thus empowering you to make informed decisions and respond to potential issues before they escalate into larger problems. Here is the walkthrough video you can follow.
Getting Started with Cloud Monitoring
To kick things off, you need to access the monitoring dashboard in Microtica. This dashboard serves as your command center, giving you a comprehensive overview of your cloud environment's health. Here, you can visualize critical metrics in real-time, which allows for quick assessments and informed decision-making.
The layout is user-friendly, ensuring that both technical and non-technical users can navigate through various features seamlessly. From CPU usage to network traffic, the dashboard aggregates vital statistics that play a significant role in the overall performance and stability of your cloud applications.
Understanding the health of your infrastructure at a glance enables proactive management and timely interventions, crucial for maintaining high availability and customer satisfaction.
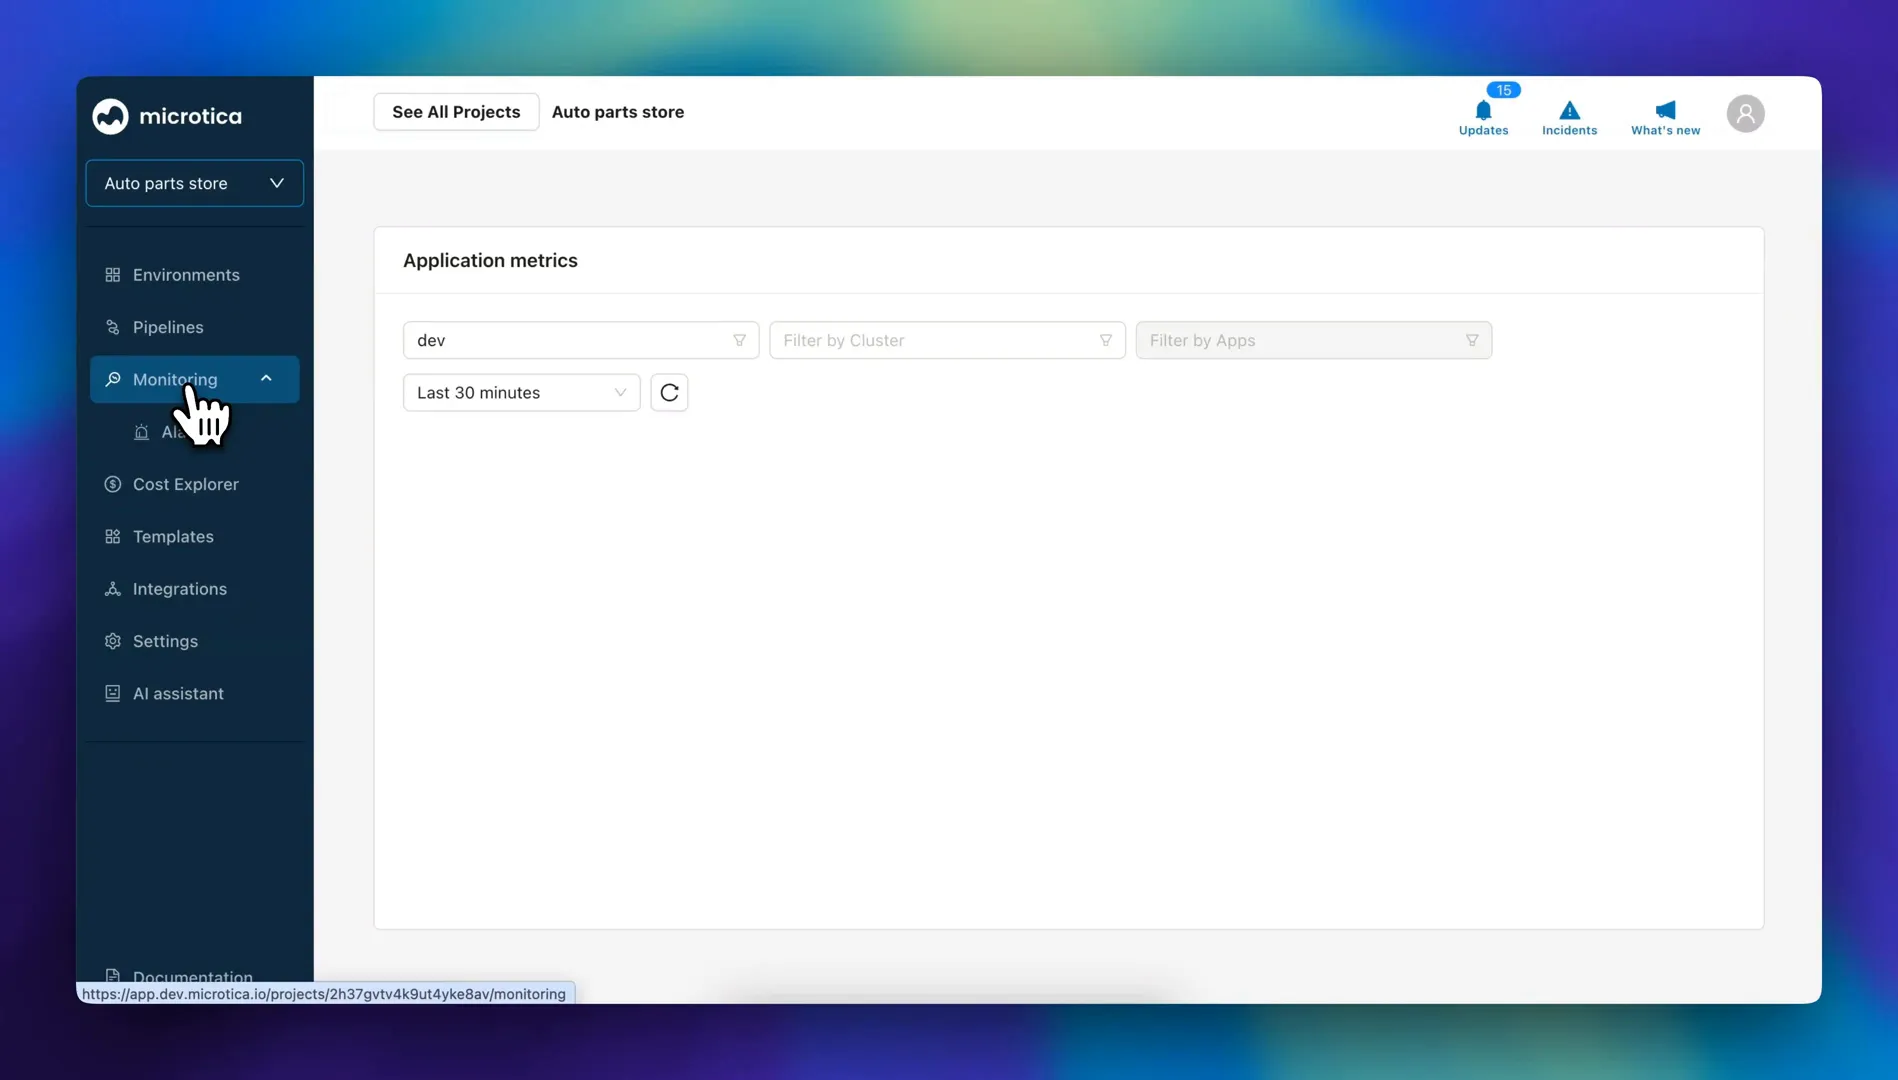
Once you're in, select the environment you want to monitor. After choosing the environment, you’ll need to pick a specific cluster. Each cluster represents a distinct group of resources and applications that work together to fulfill your operational needs.
It’s important to remember that you must enable monitoring for the cluster to effectively track all applications deployed within it and their performance metrics. Enabling monitoring is not just a mere formality; it is an essential action that allows the system to aggregate and analyze data, providing insights that can significantly influence your infrastructure’s reliability and performance.
By doing so, you will enable real-time tracking of critical performance indicators, ensuring that any irregularities can be detected and addressed promptly, ultimately safeguarding the user experience and maintaining service continuity.
Understanding the Metrics
Once monitoring is enabled, you'll have a detailed preview of various metrics being tracked. These include the most important cloud metrics that need to be tracked for application health, like:
- CPU Usage
- Memory Utilization
- Database Connections
- Server Errors
- HTTP Errors
- Network Traffic
For example, if you're monitoring a Medusa e-commerce app, additional metrics that enhance your monitoring efforts include:
- Redis CPU utilization, which measures the processing power used by Redis,
- Redis connections, which track the number of simultaneous connections to your Redis instance,
- cache misses and hits that indicate the efficiency of your cache system—where hits show successful cache retrievals and misses show when data was not found in the cache,
- as well as cached items that reflect the total number of data entries currently stored in the cache.
All these metrics provide deeper insights into application performance and user experience, allowing you to optimize resources and troubleshoot issues effectively. Understanding these metrics is vital for ensuring that your e-commerce platform runs smoothly and remains responsive to customer demands.
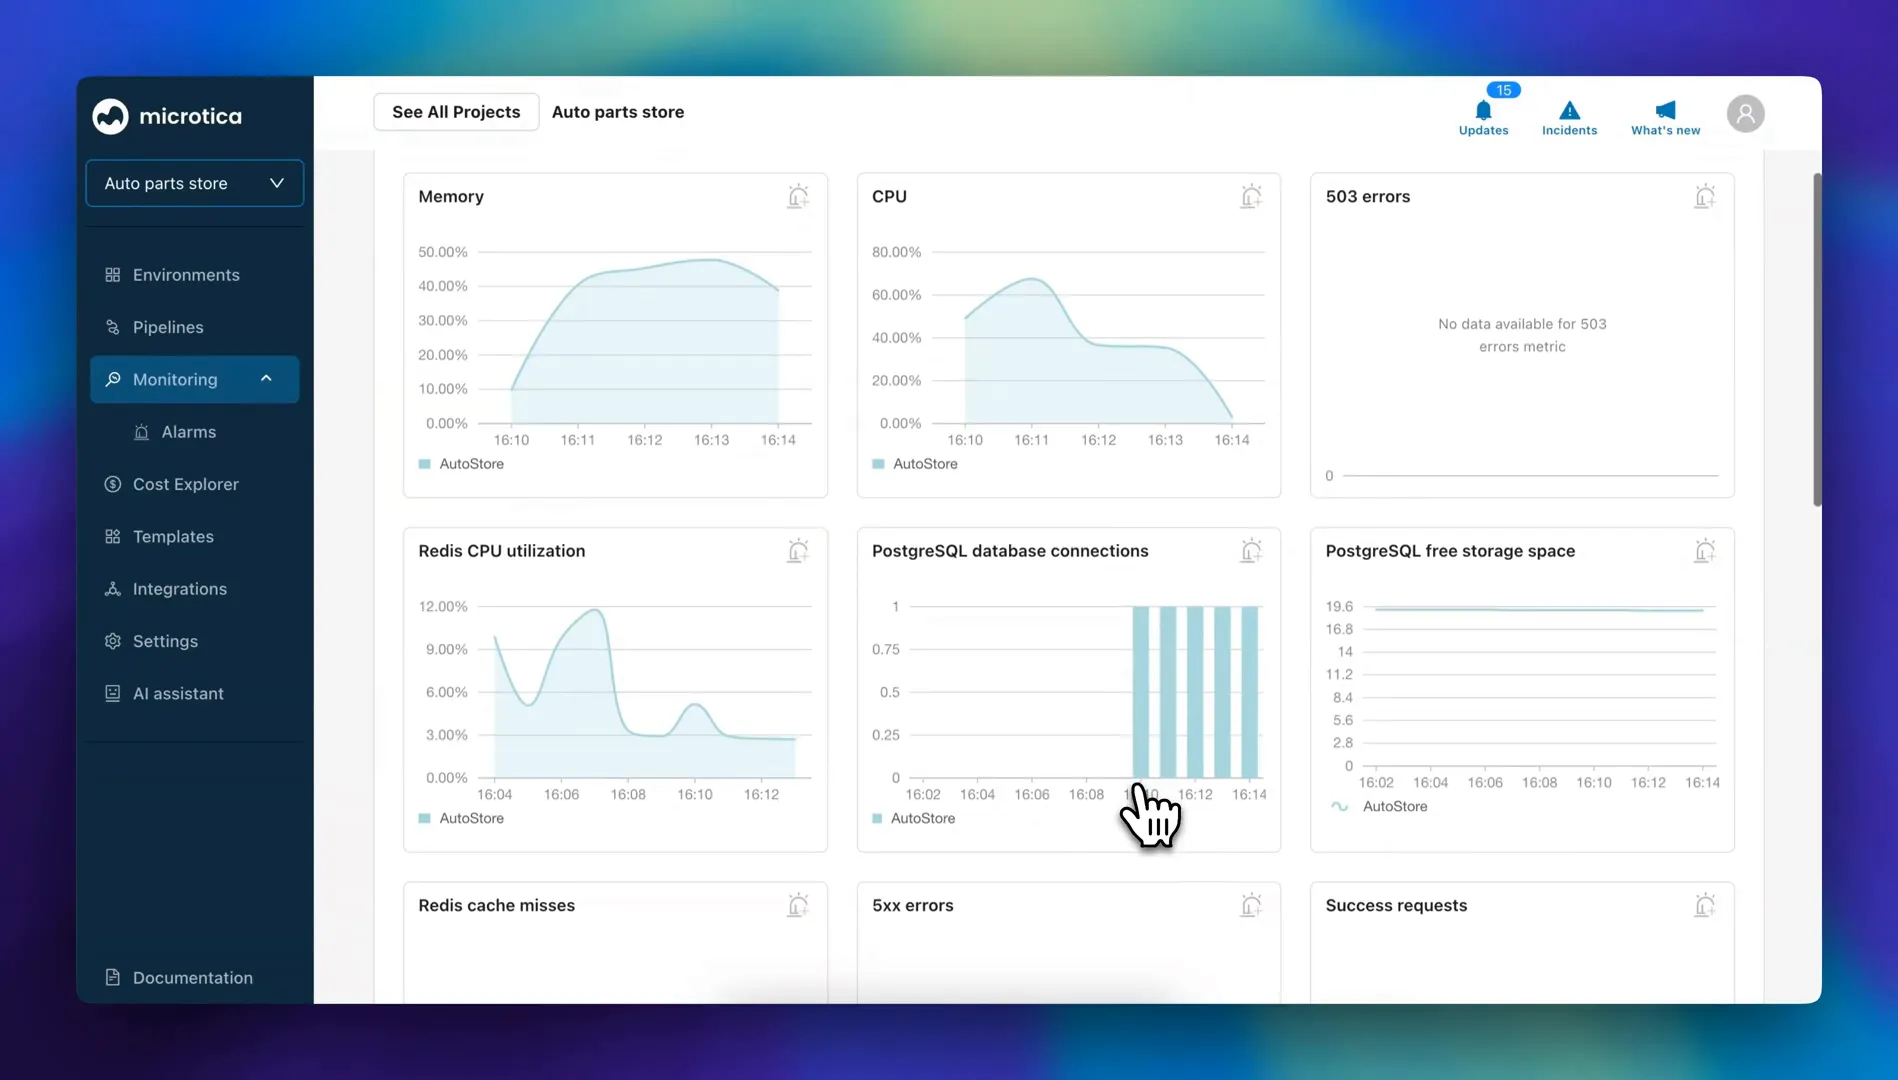
Additionally, Microtica integrates monitoring for databases, such as PostgreSQL, and with that offers a comprehensive solution by tracking a variety of critical metrics. These metrics include essential parameters like storage space, CPU utilization, memory usage, and various error metrics that are vital for diagnosing potential issues.
By aggregating this data, Microtica enables users to gain a holistic view of their database performance, so that any anomalies can be promptly identified and addressed.
Moreover, the platform provides the flexibility to filter these metrics by specific applications. This feature allows you to hone in on the performance of individual applications, like the Medusa app, making it easier to analyze and optimize their operations based on real-time performance data.
Such targeted insights are invaluable for maintaining the smooth running of your applications. They enable developers and IT teams to respond effectively to any performance-related concerns.
Creating Alerts for Proactive Monitoring
To enhance your monitoring capabilities, Microtica allows you to set alerts that are easy to configure and crucial for maintaining optimal application performance. You’ll notice an alarm icon displayed in the corner of each metric chart, which you can click to create an alert tailored to specific metrics that are critical to your operations. This proactive approach ensures that you’re promptly notified when certain thresholds are met or exceeded, enabling you to act swiftly before issues escalate into more significant problems.
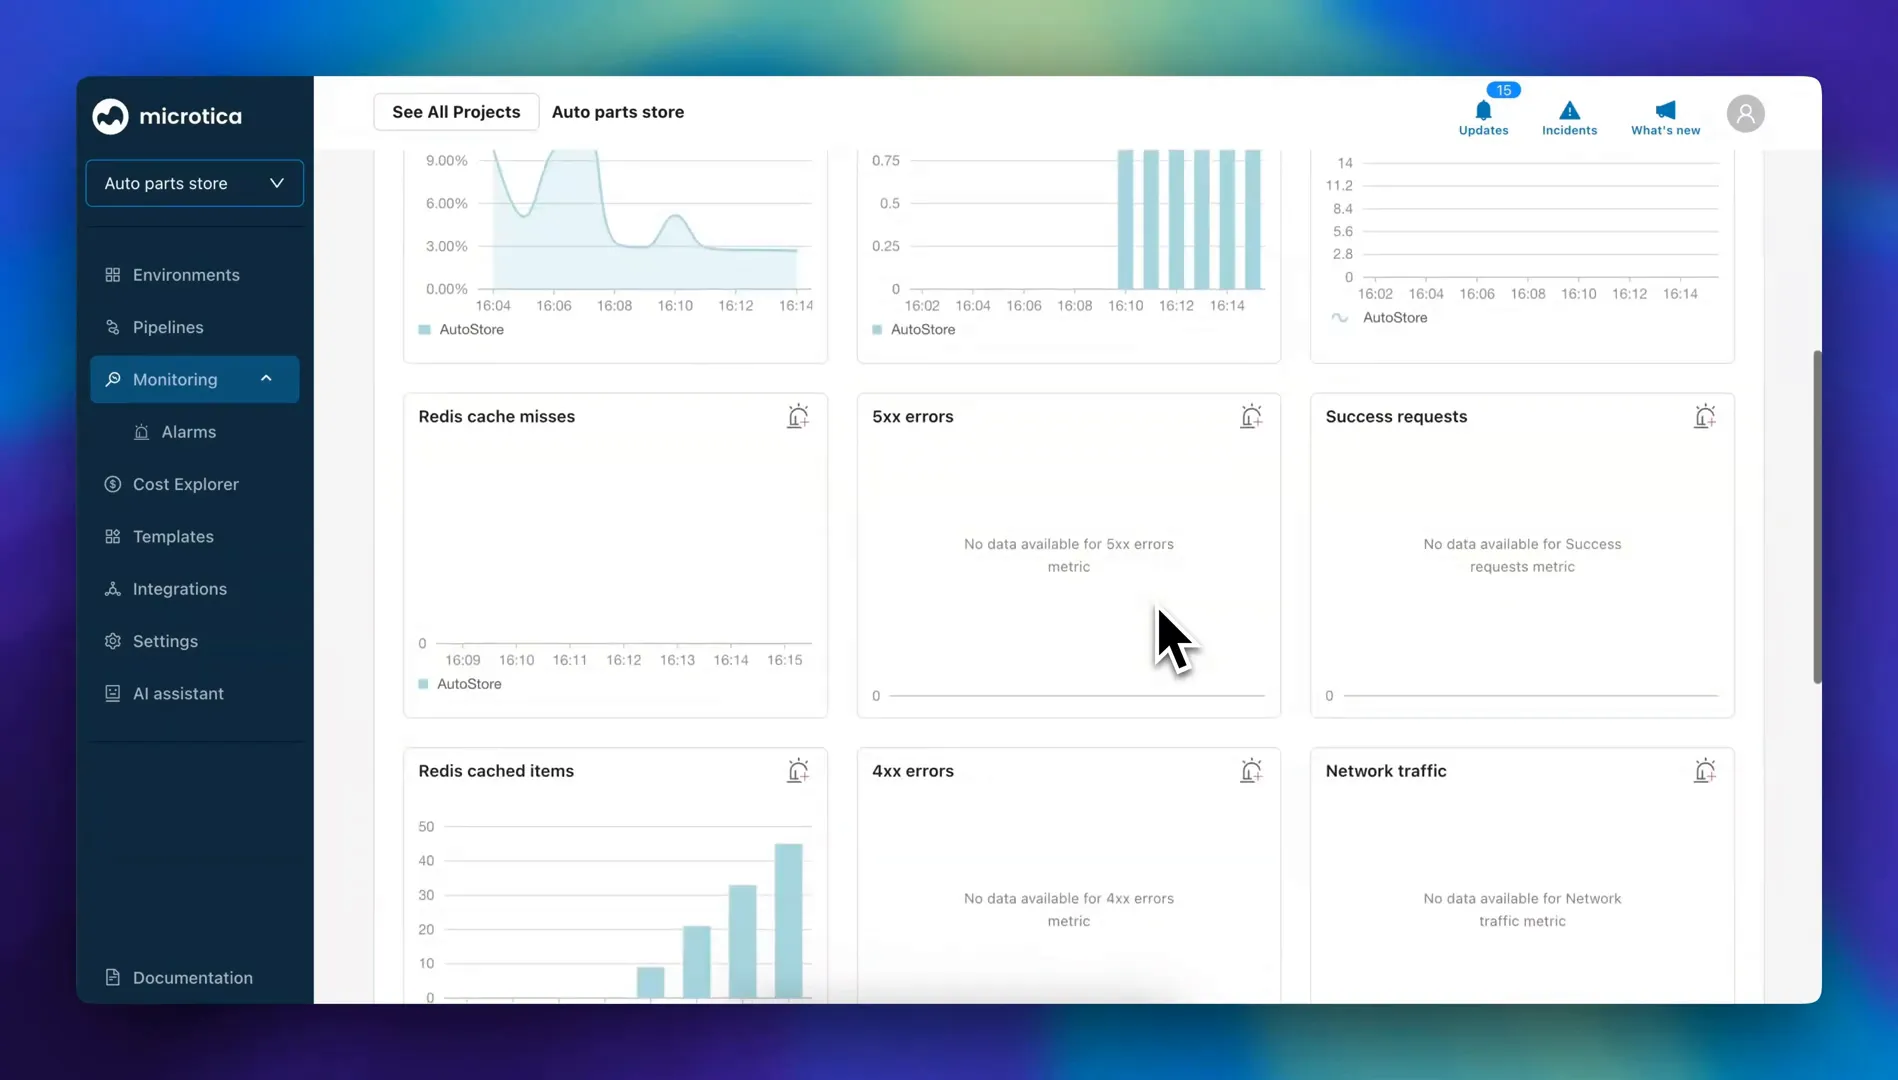
To illustrate how this works, in the video we simulate a scenario with the Medusa app. We create intentional errors and set up alerts to notify us when these occur.
Setting alerts is a straightforward process that empowers users to customize their notifications based on unique needs. For instance, you can define precise threshold values for different metrics such as CPU usage, memory utilization, or error rates, and set the severity level for notifications. This means that you will only receive alerts that matter to you, allowing for a more focused and effective response strategy. By doing so, you are equipped to maintain a closer watch on the health of your applications and can take immediate action when something goes awry.
Moreover, the ability to set alerts fosters a culture of proactive monitoring within your team, transforming how you manage your cloud infrastructure. With alerts in place, you can bridge the gap between monitoring and action, making it easier to ensure that your applications run smoothly. This feature is especially valuable for teams managing multiple applications, as it allows for centralized oversight and quicker response times to any irregularities.
Receiving Alerts as Email Notifications for Immediate Awareness
When an error is detected, for which an alert has been set, you receive an email notification that serves to ensure you stay informed about potential issues with your application. This email is meticulously crafted to provide you with all the relevant information you need to investigate the problem effectively. It includes comprehensive details about the application that is experiencing the error, such as its name and the specific services it utilizes. Additionally, the email specifies the hosting AWS region, helping you understand where the error occurred within your cloud infrastructure.
One of the key features of this notification is that it outlines the specifics of the error, in our example particularly indicating that it has exceeded three 4xx errors within a 60-second window. Understanding the nature of 4xx errors is crucial, as they typically signify client-side issues, such as incorrect requests made by the user or problems with the application's configuration. This level of detail in the notification allows your team to quickly assess the situation, prioritize responses, and mobilize the necessary resources for resolution.
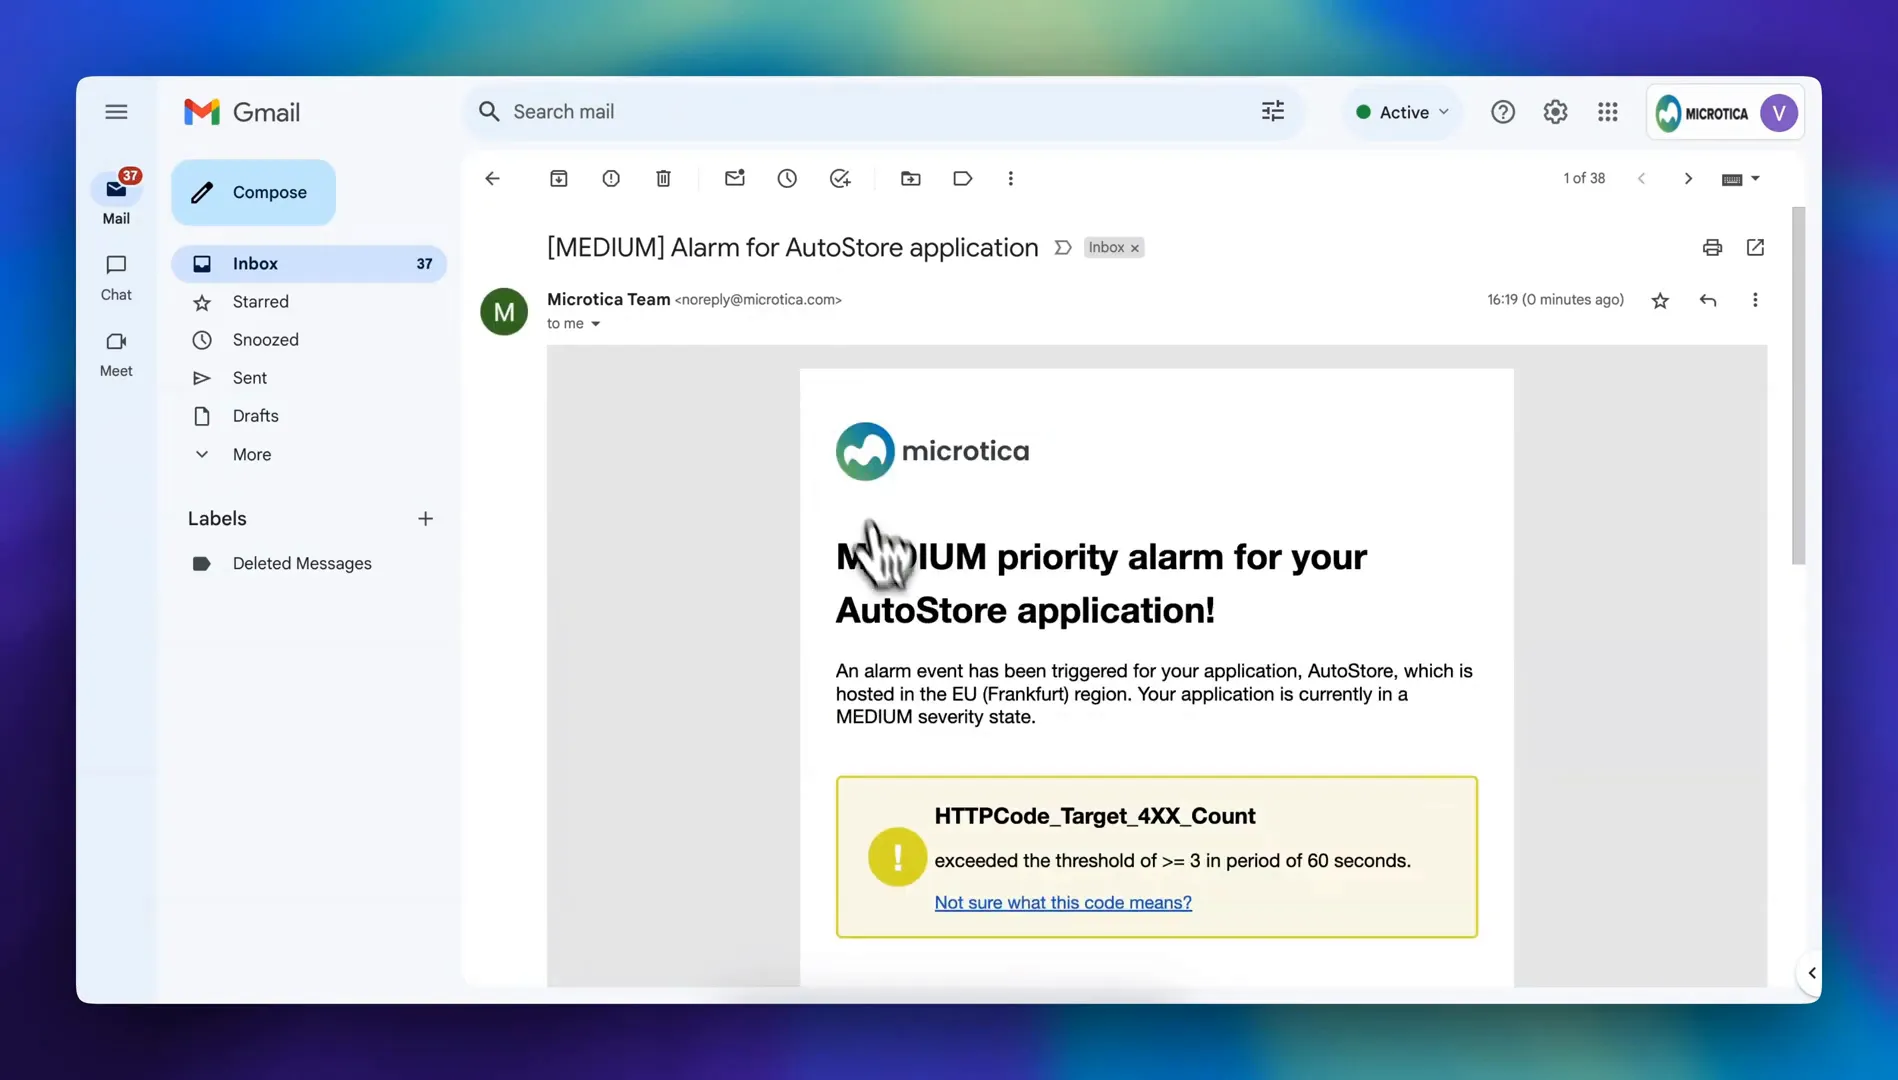
Furthermore, the email notification not only prompts immediate attention but also serves as a valuable record for ongoing analysis. By documenting the number of errors and the timeframe in which they occurred, it enables teams to identify patterns and potential underlying issues that may require further investigation.
From the email you can directly navigate to Microtica's Alarms and Incidents Dashboard. This dashboard provides a centralized view of all ongoing issues, making it easy to manage and prioritize resolutions. It also displays metrics in context with the alarm, giving you a clearer picture of what’s happening with the app.
Diving Deeper into Error Investigation
To investigate the error further, you can access detailed logs that provide an in-depth view of the system's activities leading up to the issue. This functionality is crucial as it allows you to pinpoint the exact cause of the problem, whether it be a configuration error, a spike in traffic, or an unforeseen application failure.
By analyzing the logs, you can gather valuable insights that guide you toward taking appropriate corrective actions. Once the issue is identified, resolving the alarm is straightforward and can be done directly from the alarm's dashboard, which offers a user-friendly interface for managing incidents.
This streamlined process minimizes downtime and helps maintain the reliability of your services, ultimately contributing to a better user experience.
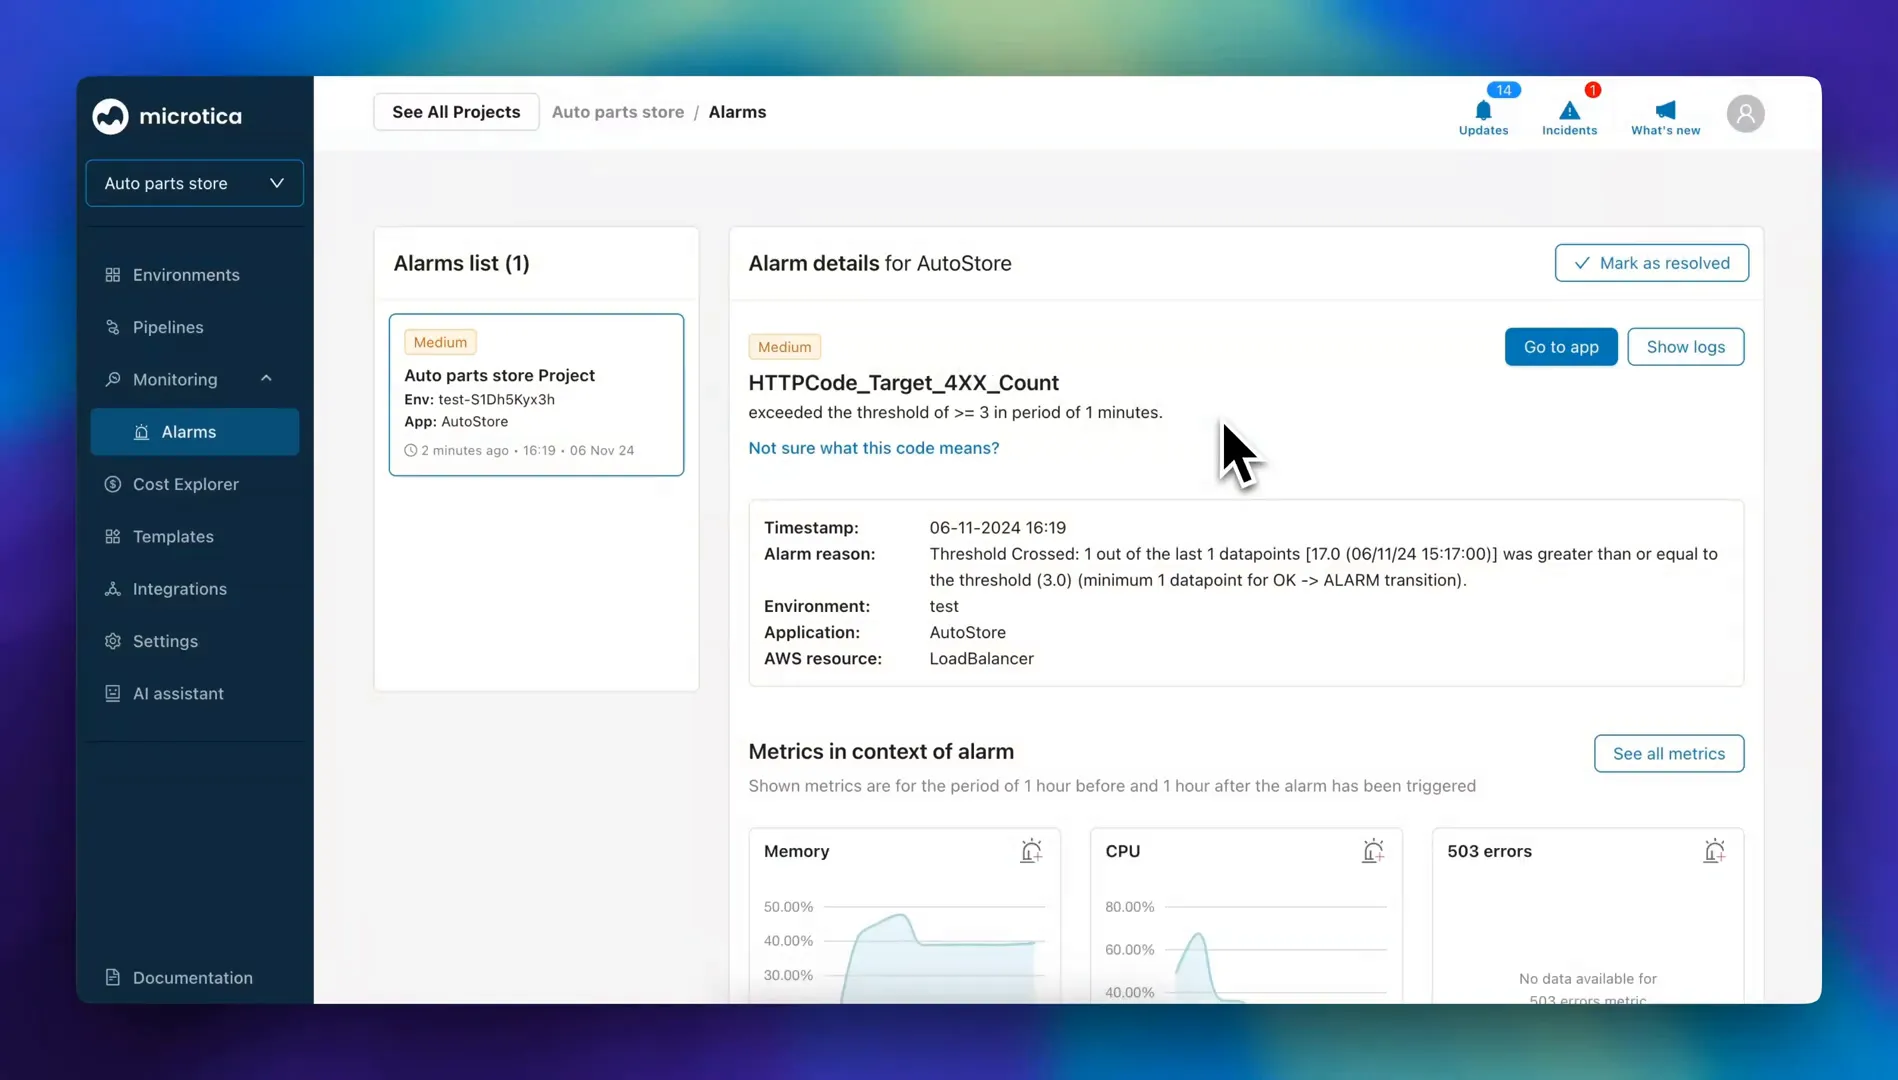
In summary, after addressing the root cause—be it a misconfiguration or an unexpected spike in traffic—taking corrective action restores the system to a stable state. This not only ensures the health of your infrastructure but also maintains reliable services for end-users.
Conclusion
Utilizing Microtica empowers you to swiftly resolve incidents, maintain optimal performance, and deliver an excellent user experience. By setting up monitoring and alerting functionalities effectively, you can stay ahead of potential issues and ensure seamless operations within your cloud environment.
Interested in trying Microtica? Sign up and see how it can transform your cloud monitoring experience today!
Subscribe to receive the latest blog posts to your inbox every week.
*By subscribing you agree to with our Privacy Policy.

Relevant Posts


